 A few nights ago SMP released the first round of stats for the season, so the SocialPb team got together and thought “What can we possibly do with these?” Our answer was to start at the beginning – specifically, the break.
As we all know, a team who can get eliminations off the break during a match is usually the more successful team: playing up on bodies can do wonders for team energy and make for quick points. Of course, there is possibly nothing more demoralizing than being shot up early, point after point; and now that we have some basic statistics we are able to take a look and see just how important getting that quick elimination can be. Also, part of a team being solid in the first few seconds of a game is how many times they get eliminated. To do this we will give a +1 for every elimination a team has off the break, and a -1 for every player they lose; and we will call it the “Break Efficiency.” However, for this article we will also be taking a look at the average percent of the time a team gets an elimination off the break.
Oh, and please remember that these numbers are incomplete because the Galveston Island event is not “over.” We are still missing some Saturday games, and all of the professional finals.
San Diego Dynasty
It’s remarkable that Dynasty has had such a great tournament considering what little effect they had off the break, and considering that it seemed that Dynasty had four or five guns up every point. In 34 points they only eliminated seven players, and lost seven. This brings their Break Efficiency to an ugly 0% and in this event they have averaged an elimination off the break 20.58% of the time.
Los Angeles Ironmen
During our last review I praised the Ironmen for their off the break play, but was I dead wrong? At the moment: no. Los Angeles played a total of 43 points, shooting a total of fifteen bodies out on the break. However, they did lose a few themselves so that brings their Break Efficiency to 13% and their shooting to a juicy 34.88%.
Tampa Bay Damage
Here is where the numbers are going to look a little odd. There is not doubt that Tampa Bay Damage is one of the elite paintball teams in the world right now, but they were only able to play two games at the Galveston event. Right now Damage is putting up 9% for their BE, but with only 21 points played there is no way you can call this a correct representation of the team. With these incomplete numbers Damage is managing to achieve an off the break elimination 42.85% of the time!
Houston Heat
One of the most exciting things during the event was the new professional team, Houston Heat, make their debut. Unfortunately we only got one good look at them against Moscow Red Legion. Here is what we have. In 24 points Houston eliminated six players, but lost five themselves which makes their BE 4% and brings their average eliminations off the break in at 25%.
LA Infamous
Infamous has had a tough tournament so far and the numbers here reflect it. Currently they are sitting at -1% Break Efficiency due to them only shooting seven players off the break, but losing nine in 20 total points. Granted, they were also victims to the weather and played two games, this may be the lowest Break Efficiency of the event – so far. However, they have managed to eliminate an opposing player 35% of the time which bodes very well!
 Moscow Red Legion
Nobody denies that Moscow is in a rebuild year, but I honestly expected these numbers to be a little higher. In 25 points the Red Legion eliminated six players off the break, but also lost six total bringing them to a 0% Break Efficiency, like Dynasty, and are averaging an elimination 25% of the time. Although this may be coincidence, all the numbers point to the first Houston versus Moscow game being a complete dead heat, which it was – looks like these numbers are able to tell a story after all.
Seattle Thunder
In their inaugural match, Thunder did not play poorly. They even have the numbers to prove it. Out of the four games they played they received a Break Efficiency of 4% by managing to grab nine eliminations and be eliminated seven times – in 38 points; which puts them ahead of Dynasty, Moscow, and Infamous. Granted, other than Dynasty the previous two teams mentioned have only played two games each, not four and their average rate of elimination is at 23.68%.
San Antonio X-Factor
In a total of 43 points, San Antonio X-Factor eliminated 13 players, but lost 11 of their own. This gives them a Break Efficiency of 4%, tied with rookie team Seattle Thunder, but they did edge out Thunder in the average rate of elimination at 30.23%.
Omaha Vicious
Sitting at 0-2 for the event, I originally expected the numbers of Vicious to be worse than they are. Vicious comes in with five eliminations and four losses in 21 points which puts their Break Efficiency at 4%. Also, they are doing well with a respectable average elimination rate of 23.80%.
upTon 187 cRew
Simply stated, upTon came up swinging against Moscow and really turned some heads in their first PSP professional game. They were able to eliminate five players, and lose six in 22 points which will put them at a low -4% for their Break Efficiency. But, they will walk away from their two games with an average elimination rate of 22%.
Chattanooga C.E.P
Chattanooga is currently 1-3 on the season which should not qualify them for the Sunday cut; and while all stats off the break are important the most important statistic for CEP this event was penalties. Either way, in 39 points they were able to snag eight eliminations and be eliminated 12 times which makes for an awful -10% Break Efficiency. They also averaged an elimination 20.51% of the time.
Chicago Aftershock
Another penalty laden team, Chicago Aftershock was able to grab six eliminations and be eliminated 13 times off the break in 39 points. Brace yourself: this gives them a putrid Break Efficiency of -17%. They were also able to eliminate an opponent 15% of the time.
Now that we have the numbers, here is how the teams rank starting with the best, ending with the worst.

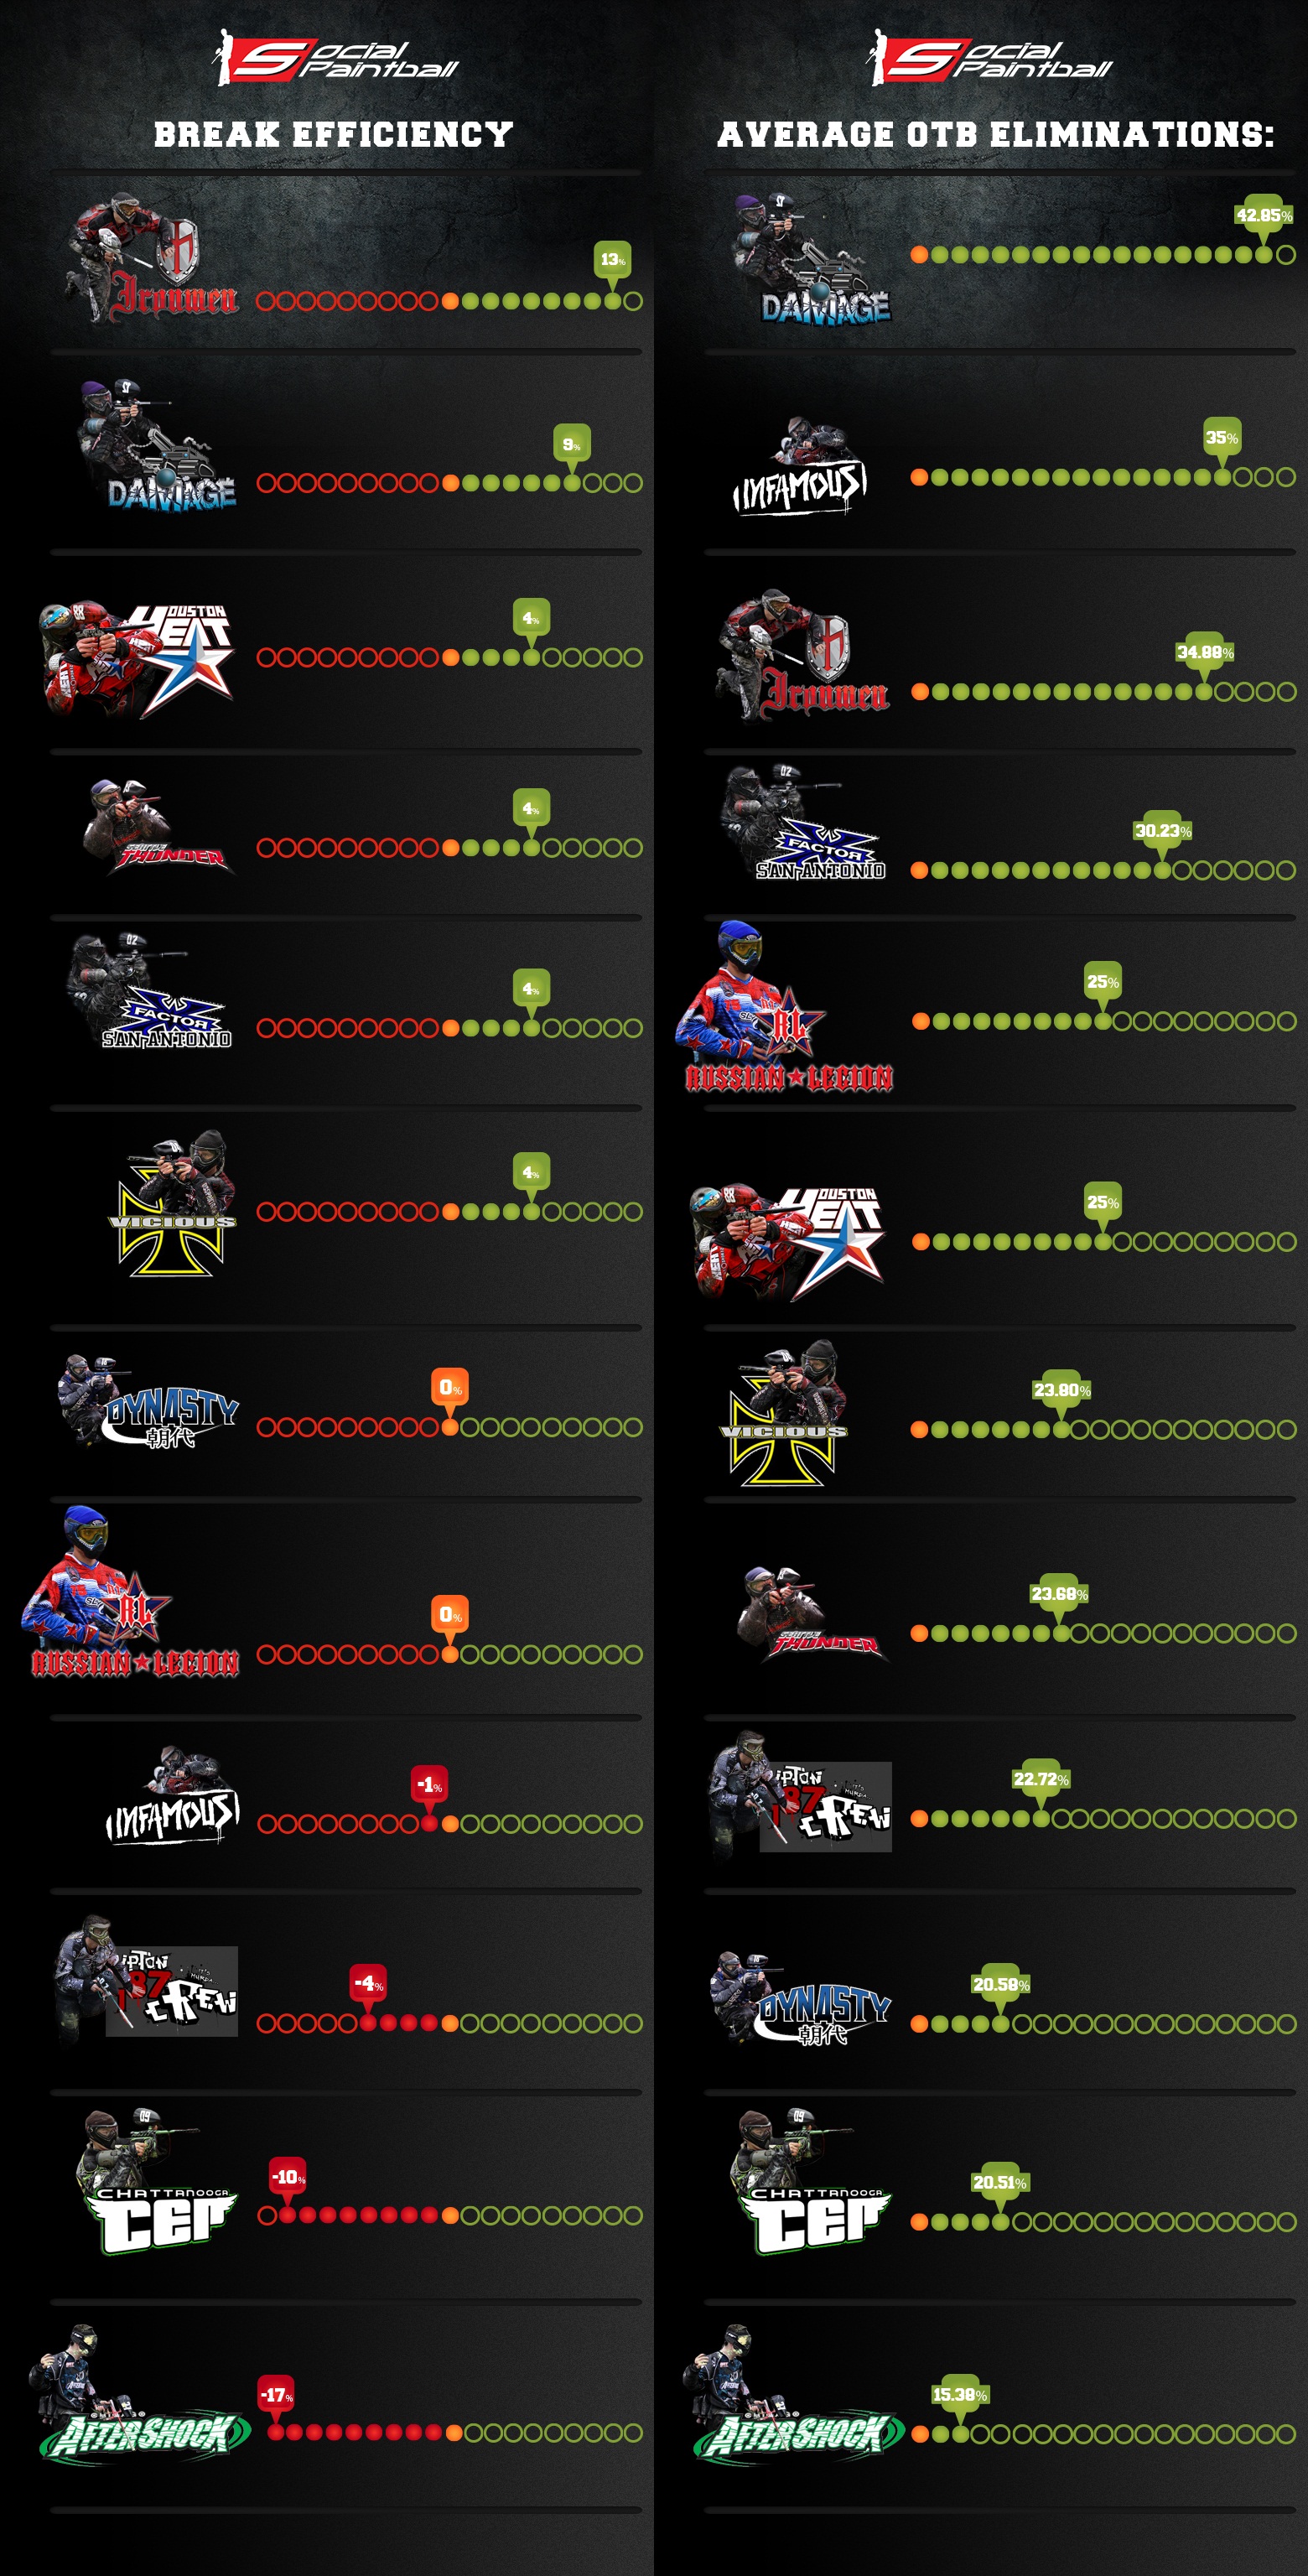
Break Efficiency:
Los Angeles Ironmen: 13%
Tampa Bay Damage: 9%
Houston Heat: 4%
Seattle Thunder: 4%
San Antonio X-Factor: 4%
Omaha Vicious: 4%
San Diego Dynasty: 0%
Moscow red Legion: 0%
LA Infamous: -1%
upTon 187 cRew: -4%
Chattanooga C.E.P: -10%
Chicago Aftershock: -17%
Average OTB Eliminations:
Tampa Bay Damage: 42.85%
LA Infamous: 35%
Los Angeles Ironmen: 34.88%
San Antonio X-Factor: 30.23%
Moscow Red Legion: 25%
Houston Heat: 25%
Omaha Vicious: 23.80%
Seattle Thunder: 23.68%
upTon 187 cRew: 22.72%
San Diego Dynasty: 20.58%
Chattanooga C.E.P: 20.51%
Chicago Aftershock: 15.38%
Do these numbers tell the whole story? Of course not. One of the reasons that Chicago has such an awful BE is due in some small part to their overly aggressive game-plans employed by coach Mike Bruno. Conversely, Dynasty looks dominant but their average OTB eliminations are very low at this point and they have a BE of 0%. It is unfortunate that we are not able to see what these numbers would be during a full event until Phoenix, but it may prove interesting to see how these numbers fluctuate next event from where they are.
Also please remember that I am not a mathematician and these are just basic averages that tell just the tip of the iceberg of what we can uncover. We are sure that as these statistics evolve, so will the methods in which we analyze them, but this was a fun starting point.
Some final questions for discussion:
How will these numbers change during next event/as we finish the first event?
Will these numbers be able to predict well…anything?
Unfortunately these numbers aren’t a science yet. I spoke with a CEP player last week and told him I was shocked that there was only one otb kill in their game with dynasty and it was Zack for Dynasty. He told me the stat was wrong. He was personally shot Twice on his run out but it was apparently missed in the stats.
Please keep in mind that the HOB metric happens only during the first 5 sec of the match. If a player is running a delay pattern (shoot from a center bunker for 2-3 sec and then make a bump) that player would still be be listed as Shot once hit, but would fall outside of the HOB’s 5 seconds.
The OTB efficiency is their Kill to Death +/-? So… OTB +/- ?
Barn,
You’re correct- these are not perfect numbers, but they are the numbers provided to us at the moment. Over the course of the season these will become more stable and give a better look at a teams overall skill OTB, versus a snapshot of where teams are in the Galveston event.
Also, brought up on the FB page was that these stats would tell more of a story if there was a +/- on how games were affected which is true- however we do not have point by point analysis at the moment. I’m sure it’s in the works.
-Lawrence
Very interesting
interesting breakdown
interesting breakdown
I really like the stats. They fall under the scope of scouting for me. We compile stats off our own video and charting. These stats add to and confirm in our compiling. In looking at our games, prelim opponent games and other bracket games, the misses I saw are small. (No one is crying over it).
The effort however is big. Charting games for analysis or breaking down video is labor intensive. The rule of thumb is no information is better than bad information (get back to this in a minute). Tracking live data in paintball is no small task.
The G count is what everyone naturally looks for right off the bat. But here is a lot of other information to be gleaned from these stats. The article points that out nicely. The thing is, stats are something that we can talk about between events, find trends, and they give us measurables which are a staple of any sport.
There is a matter I want to comment on here. There has been some talk around the paintball forums regarding ‘What Ifs’. For instance, what if, they only show 19 G’s in a 10 point match, these can’t be right. I’m not sure how many times Cade and the others have to say it, but the stats are Confirmed Kills.
For me, it says it can be better and I believe it will. I’d rather them give no data (see above comment) than bad information. Now if the CK’s add up to more than the potential G’s in a match, THEN I will be concerned.
Another ‘What if’, “On the video my boy Killa tha Feasta got in the snake and blew up the guy in the tower, but he didn’t get credit for it.” This is where you have to realize your vantage point is not as good as multiple spotters elevated above the playing field. While the video does in fact show the your friend shooting the guy in the tower, does the framing show the ref who was running over to call the tower out who had seconds earlier been shot by a Dorito side player?
Or my favorite, “What if a player gets up the field and pushes an opponent into a teammate’s gun, who gets credit for THAT?” The short answer is, are you serious? If our player is really concerned about this, I’d question whether we want him on the team. The other answer is, it’s called team work and it happens, hopefully, all weekend long. The O-Lineman who makes the block for his RB. to score doesn’t get the TD stat, but he did his job.
An over simplified protocol for scouting goes something like this: Parameters> Observe> Verify> Transcribe> Compile> Evaluate. Any one of these action can be subject to human judgment and in fact error. It is an effort on a big scale to do it and do it well.
The fact that these guys have worked in conjunction with the PSP, with a webcast, brought multiple, quality people to work on these statistics is very impressive. I HOPE paintballers and fans of the Pro game everywhere appreciate the effort and recognize it is a process that will only get better.
This is cool to see the difference from each team